What is a bonding curve? The pricing math behind token launchpads
The price on a launchpad is a formula you can read: what a bonding curve is, what graduation costs, and why 98.6% of tokens never make it.
A bonding curve is a formula in a smart contract that sets a token's price from its supply — and the contract itself is who you trade with. There's no order book and no counterparty waiting to take the other side. Buy, and the price moves up along the curve. Sell, and it moves back down. It's the mechanism underneath most meme coin launchpads, and the reason a token can trade one second after it's created. This guide shows you the math one live launchpad actually runs, then uses it to explain the three things buyers notice: the price moving while they buy, "graduation," and why almost nothing graduates.
Last updated: August 2026
What a bonding curve actually is
A bonding curve is a mathematical model that adjusts a token's price automatically based on its supply. The formula lives in a smart contract, and that contract holds the money and quotes the price.
The important part is who's on the other side of your trade. The contract is, which means liquidity exists from the very first trade — no order book, no market maker, no waiting for a listing. A brand-new token with zero holders is tradeable the moment its contract is live, because the contract will always quote a price.
That's the appeal, and it's also the risk in one sentence: the contract holds the funds, so the contract's code decides whether you can get them back.
Two things both called a bonding curve
Explainers describe two different implementations without distinguishing them, which is why the mechanics can seem to contradict each other.
Mint and burn. The classic model, and the one most glossary definitions describe. There's no fixed supply — the contract creates tokens when you buy and destroys them when you sell, moving supply along the curve in both directions.
Pre-mint and reserve. The model most Solana launchpads use. The full supply exists from the start, and the contract holds a fixed block of it in reserve. Buying moves tokens out of the reserve, selling moves them back, and the price comes from how much is left.
Both are bonding curves, and both price from supply. The difference matters when you're reading a contract, because in the second model the "supply" in the formula is the contract's remaining inventory, not the number of tokens in existence.
Does the curve shape matter?
Yes — it decides how much of the total price move goes to the first buyers. Five shapes come up most often:
| Shape | How price behaves | Effect on buyers |
|---|---|---|
| Linear | Rises at a constant rate per token | Predictable; mild early advantage |
| Exponential | Rises faster as supply sells | Strong early-buyer advantage |
| Logarithmic | Rises fast, then flattens | Early buyers pay up; later buyers get stability |
| Step | Jumps at set milestones | Flat between steps, then gaps |
| S-curve | Slow, then fast, then flat | Rewards the middle of the sale |
Steeper curves deliver dramatic early gains and equally sharp drawdowns. The steepness that makes an early entry look brilliant on the way up makes the exit painful on the way down, because there's no separate pool of buyers holding the price up — there's only the curve.
The math a real launchpad runs
Most launchpad curves aren't exotic. They're the constant product formula ordinary AMMs use, run against reserves the contract tracks itself.
Take the largest one. Pump.fun's curve uses the Uniswap V2 invariant, virtual_token_reserves × virtual_sol_reserves = k, and every new token starts at the same published state:
| Parameter | Value at launch |
|---|---|
| Virtual token reserves | 1,073,000,000 tokens |
| Virtual SOL reserves | 30 SOL |
| Real token reserves (actually for sale) | 793,100,000 tokens |
| Real SOL reserves | 0 |
| Total supply | 1,000,000,000 tokens |
"Virtual" reserves are a bookkeeping starting point, not deposited money — they set the opening price without anyone funding the pool. Real reserves are the actual inventory: 793.1 million tokens for sale, and no SOL until someone buys.
Run the numbers and the starting price is 30 ÷ 1,073,000,000, or 0.000000028 SOL per token. Buying is the same formula in reverse: remove tokens from the reserve, recompute the SOL reserve as k ÷ new token reserves, and the difference is what you pay.
Here's the part worth knowing. Sell all 793.1 million real tokens and the token reserve drops to 279.9 million, so the SOL reserve has to rise to 115 — meaning buyers put in 85 SOL. That's the graduation threshold everyone quotes, and it isn't a policy choice. It's what the curve costs to buy out.
Why you paid more than the price on the screen
Because the price you saw was the price of the next token, not the average across your whole order. Every token your buy removes from the reserve pushes the quote up for the token after it, and you pay the whole path.
On the constants above, the last token before graduation costs 0.00000041 SOL — 14.7 times the first one. The average across all 793.1 million works out to about 0.00000011 SOL, roughly 3.8 times the opening price. Buying early beats buying late by a lot, and both sit well above the number in the headline.
That gap is slippage, and on a curve it's structural rather than a sign of a thin market. Bigger orders eat more of the curve and land at a worse average. Coin98 Super Wallet exposes the setting directly: its slippage tolerance defaults to 0.5% and can be set to 1%, 5%, 10%, or a custom value up to 25%. Our docs note that a higher tolerance helps transactions complete in volatile markets — and on a curve moving this fast, we'd suggest deciding your worst acceptable price deliberately rather than raising the setting until the trade goes through.
Slippage isn't the only cost. Pump.fun charges a 1% fee on every trade, and insiders routinely accumulate supply cheaply before promoting a token. The earliest buys are always the cheapest ones on a curve, which is why the same MEV and sandwich pressure that affects ordinary swaps also lands on the first trades after a launch.
What graduation means, and what it doesn't
Graduation means the curve sold out and the token moved to a normal AMM pool. It says nothing about the project.
Mechanically it's precise. The curve is complete when its real token reserves hit zero and the completion flag is set — a flag that never reverts — after which the token is eligible for migration to the PumpSwap AMM. The supply split behind it: 800 million tokens on the curve, 200 million held back to seed the pool at graduation. The general pattern is the same across launchpads — the raised funds and the reserved supply become an open liquidity pool, and the curve retires.
Independent measurement of 832,941 launches over May and June 2026 puts the threshold in the same place: graduation happens when the bonding-curve reserve reaches roughly 85 SOL in real reserves, on top of the 30 SOL virtual bootstrap, and the token migrates to PumpSwap.
Two things people misread about it:
The ~$69,000 market cap figure isn't a rule. Put the graduation numbers through the market cap formula and the curve implies about 410 SOL at that point. Whether 410 SOL is $69,000 depends on what SOL is worth that day — the dollar figure drifts, the SOL figure doesn't.
Graduation measures money in, not quality. Reaching that threshold reflects buying pressure, not the merit of the project. Enough buy orders arrived to clear the inventory. That's all it means. After migration the token trades in a standard pool, where the pool's own risks replace the curve's.
What the numbers say about the odds
They say most tokens on a bonding curve go nowhere, and the data isn't close.
Between January 2024 and March 2025, more than 7 million Pump.fun tokens with at least five trades were deployed, and only 97,000 kept liquidity above $1,000. That's 98.6% collapsing into worthless pump-and-dump schemes shortly after launch. Across the same period, 388,000 Raydium pools were examined and roughly 93% showed soft-rug characteristics, with a median rug pull of about $2,832 — small, frequent, and aimed at retail buyers.
Graduation is rarer still: fewer than 2% of tokens launched ever reach it. Structure explains much of that, since insiders accumulating 20–30% of supply cheaply before promotion is exactly what the curve makes easy — the earliest buys are always the cheapest.
None of this makes the mechanism dishonest. A bonding curve is a pricing function, and it prices exactly as specified whether the project is real or not. It just gives you no information about which one you're looking at.
What to check before you buy
- Read the curve's parameters, not the chart. How much supply is on the curve, what the threshold is, how much has already sold. That tells you where on the price path you'd be entering.
- Check holder concentration. If a handful of wallets hold 20–30% bought at the bottom, your buy is what they're planning to sell into.
- Size the position for a total loss. Against a 98.6% collapse rate, that's arithmetic rather than pessimism.
- Don't read "audited" as "safe." An audit covers specific code at a point in time — our guide on what an audit does and doesn't cover sets out the limits.
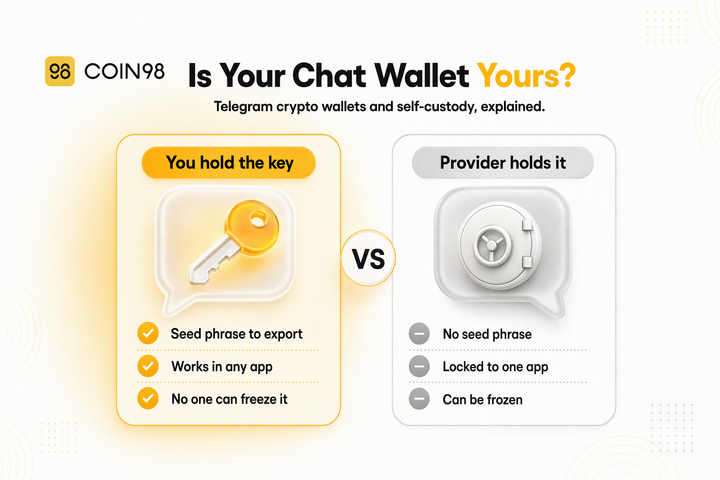
- Keep custody of your keys. Reaching a launchpad through the dApp browser in Coin98 Super Wallet lets you interact with the contract from a self-custody wallet, and our Solana meme coin guide covers the pre-trade checks in more detail.
Frequently asked questions
Is a bonding curve the same as an AMM? They're close relatives and often run the same math. Pump.fun's curve uses the Uniswap V2 constant product formula, the same invariant ordinary AMM pools use. The difference is what backs it: an AMM pool holds two assets deposited by liquidity providers, while a bonding curve starts with virtual reserves and no deposits, so it can quote a price before anyone has funded anything.
Can I sell at any time? Against the curve, yes — that's the design, and the contract quotes a sell price whenever it holds funds. Two caveats. You sell back down the same curve, so you get the path price rather than the last quoted price. And a malicious or faulty contract can restrict selling entirely, trapping or draining the funds it holds. That's a contract risk, not a bonding curve risk.
What happens if a token never graduates? It keeps trading on the curve, usually at a falling price as early buyers sell back. Nothing forces a resolution and nothing expires. Only 97,000 of more than 7 million tokens holding even $1,000 of liquidity is what "never graduates" looks like at scale.
Who gets the money I put in? While the curve is live, the contract holds it as reserves — that's what funds sells. At graduation it moves into the new liquidity pool. Along the way the platform takes a fee on each trade, which on pump.fun is 1%.
Are bonding curves only used for meme coins? No. The design comes out of 2017-era token engineering — Simon de la Rouviere's continuous token work and Bancor's reserve-ratio model — and was used for curation markets, DAO shares, continuous funding, curve-priced NFT mints, and social tokens before pump.fun's January 2024 launch industrialised it. Meme coin launchpads are simply where it's most visible, because instant liquidity matters most when a token has no listing and no market maker.
The takeaway
A bonding curve replaces the order book with a formula: price comes from supply, the contract is your counterparty, and liquidity exists from the first second. Read the parameters and you can work out your entry price, your slippage, and what graduation would cost — before you commit anything. If you want to look at one, do it from a wallet that keeps your keys on your device: Coin98 Super Wallet reaches launchpads through its built-in dApp browser.